1. This Utility gives the User the capability of combining the results of several Measures Files (CONTAINING THE SAME RACERS NAMES) and producing a result that tabulates the Best “x” results of “y” Races for each Racer in a total column.
a. “x” = the number of Races or Runs that are to be included in the total. b. “y” = the number of Races or Runs that are to be evaluated.
2. BESTOF Allows you to:
- combine a number of Measures Races and produce the Best ‘x’ of ‘y’ Racers (Ie: Best 4 of 6).
- take the best 5 runs of say 7 two-run races. In other words of the 14 runs made you can get a BESTOF Result for say 5 of them.
- subtotal a number of Races then take the Best of the Subtotals.
- outputs the results to a ".csv" file (ie: Comma Separated Value File) which if double clicked on opens in Excel.
- produce an output that includes the Racers Name and other associated information including columns for each Race or Run that was included along with a column that contains the Total of the Best “x” results.
- Use races with different disciplines providing there are no sub-totals.

3. The Utility handles “DNS’s, DNF’s and DSQ’s” by assigning a Race time of 600seconds or 10 minutes to those runs. This ensures that these runs will NOT be included in the calculation unless they are actually one of the racers BEST “x” times.
4. This can happen in the case of a Racer “DNFing” all runs or possibly all but a couple of runs. If the program is asked to calculate say the best “2” or “4” runs and the racer has “DNF’d” say three of them then his/her total would be 600 plus the time of the run that they did actually complete.
5. It is recommended; BUT not required, to use this program with 1 run races. This ensures that a Racer whom Did Not Finish run 1 will get full accreditation for a successful run 2. This is suggested because Measures will not report the results of a Racer’s run 2 if they DNS’d, DNF’d or DSQ’d Run 1. This is of course “FIS” rules.
2. Installing the BestOf:
a. If BestOf is already installed on your computer and you wish to install a new version make sure to uninstall the old version first. To do this Click on
i. Start > Control Panel > Add/Remove Programs ii. Click on ‘BestOf’, highlighting It, then Click on the Uninstall Button
b. Once BestOf is uninstalled, Close the Add/Remove Programs screen by clicking on the “x” in the top right hand corner.
c. To install the Utility, Open the Folder “BestOf Install” on the Measures CD or the Folder in which you unzipped the e-mailed zipped file BestOfxxx.zip (where xxx is the version).
d. Once the folder is open simply double click on the setup.exe file and follow the instructions.
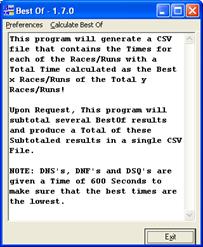
3. Running BestOf:
a. Once the Utility has been installed on the “SAME” computer that is running the “Measures” software, the program can be run by Clicking on:
Programs -> Measures -> BestOf
i. Simply Click on preferences to change to “French” if you so desire.
ii. Click on “Calculate Best Of” – the following window is displayed:
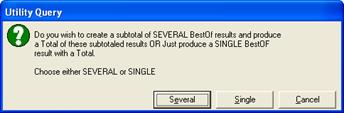
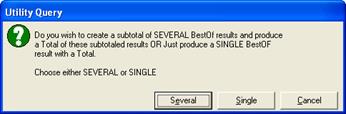
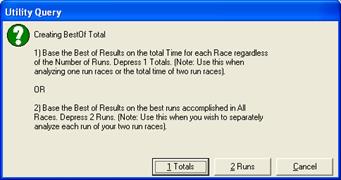
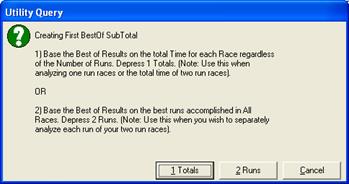
b. Click on ‘Calculate Best of’ at top of window. The following Utility Query is displayed
i. SEVERAL will create subtotals of multiple results and produce a Total of these subtotaled results
ii. SINGLE will produce either the BestOF result with a Total of all runs or just the best run.
Choose either SEVERAL(see paragraph 8) or SINGLE (see paragraph 10)
4. SEVERAL BEST OF RESULTS – SINGLE RUN RACES:
Click on the “SEVERAL” Button (if you wish to say, get the Best 1 of 2 One Run Races made in the morning and subtotal it, then get the Best 1 of 2 One Run Races made in the afternoon, then Total the two subtotals. What you are actually doing here is picking the best run made in the morning and the best run made in the afternoon then summing these two runs together to get the Total for each racer). The following Utility Query appears:

Click on the number of BestOf Results that you wish to subtotal.
Following are several examples of reports that can be run.
Several Example 1: In the “SEVERAL” figure above you would depress the [‘2’] Button.
- Runs: 4 – 1-run SGs
- Subtotals – 2 (1 after each 2 runs)
- Report Result: Total of all 4 runs

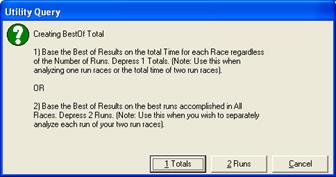
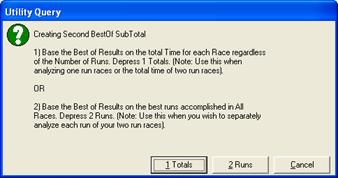
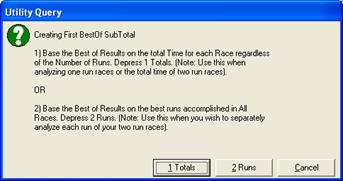
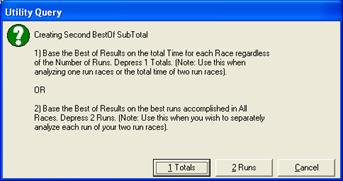
Click on ‘1 Totals’. Use this when analyzing one run races or the total time of two run races. The following query is displayed:

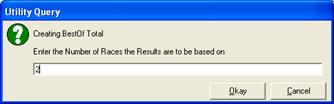
Enter the number of races the results are to be based on – in this example I have entered 2. Click ‘Okay’. The following query is displayed:

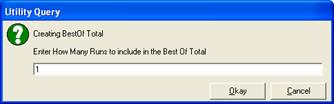
Enter the number of races to include in the Best of Total. In this example, it is 2. Click on ‘Okay’. The following query is displayed:
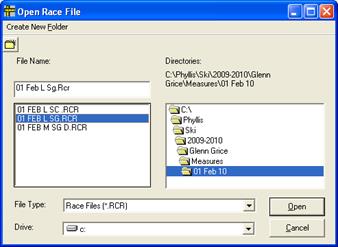
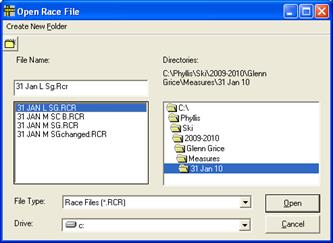
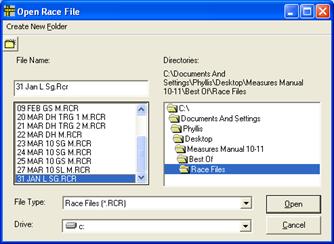
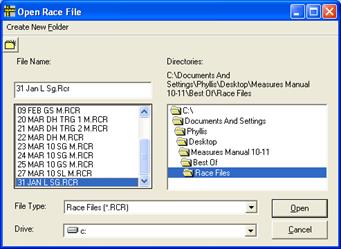
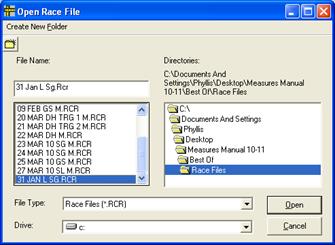
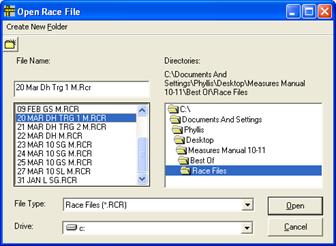
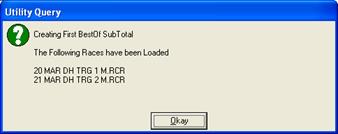
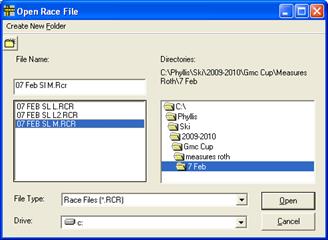
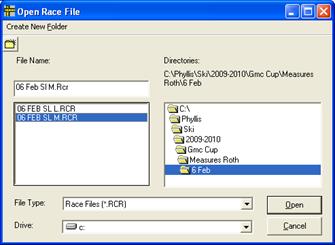
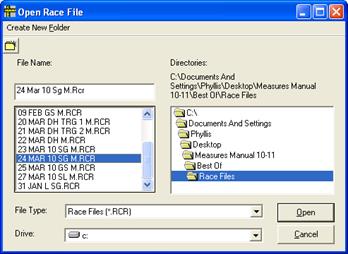
Find the first Race File and select it. Click on ‘Open’. The following Query is displayed:

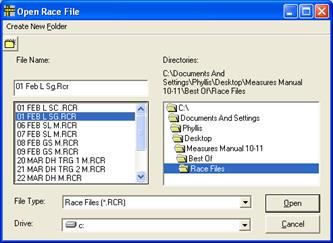
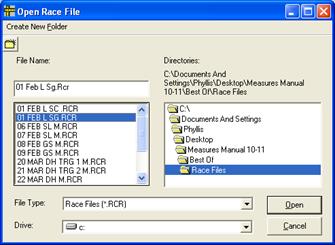
Find the second Race File and select it. Click on ‘Open’. The following query is displayed:
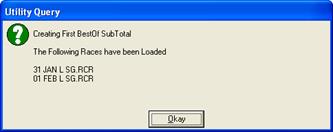
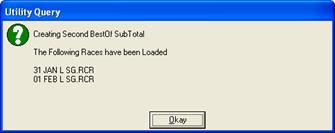
Click on ‘Okay’. The following query is displayed:

Click on ‘1 Totals’ for 1-run races. The following query is displayed:

Enter the number of Races the Results are to be based on. In this example, it is 2. Click ‘Okay’ and the following query is displayed:

Enter the number of Races to include in the Best of Total. In this example, it is 2. Click on ‘Okay’ and the following query is displayed:

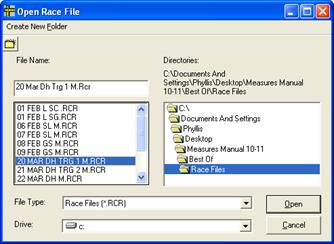
Select the first race file. Click on ‘Open’. The following query is displayed:

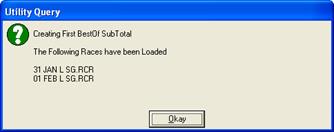
Click ‘Okay’ and the following Query is displayed:
Select the second race and click on ‘Open’. The following query is displayed:

Click ‘Okay’. The following query is displayed:
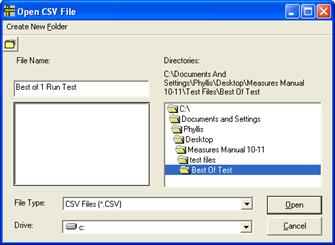
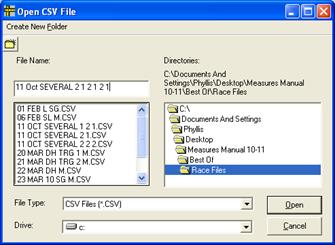
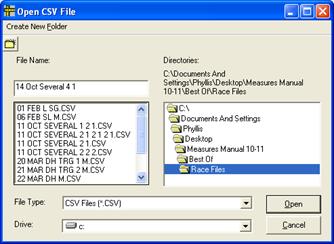
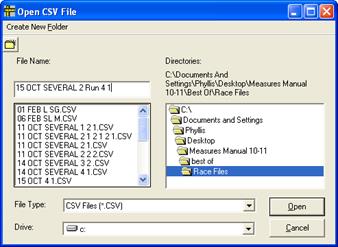
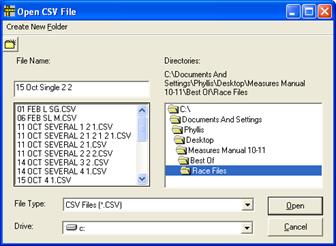
Select where you want the .csv file to go. Name the file (ie: Best of 1 Run Test) and click ‘Open’. The following query is displayed:

Click ‘Yes’. The following query is displayed:

Click on ‘Okay’.
Following is an excerpt of the .csv file that was created. (opened with Excel):
| Bib | Name | Code | CAT | DIV | Club | SG Race 1 | SG Race 2 | Sub Total | SG Race 3 | SG Race 4 | Sub Total | Grand Total |
|---|---|---|---|---|---|---|---|---|---|---|---|---|
| 13 | TURNER Andrea | 63055 | U16 | ALTA | KASC | 60.68 | 60.99 | 121.67 | 60.68 | 60.99 | 121.67 | 243.34 |
| 11 | KOLBJORNSRUD Anna | 62977 | U16 | ALTA | CARC | 61.22 | 61.03 | 122.25 | 61.22 | 61.03 | 122.25 | 244.5 |
| 38 | MELINCHUK Hannah | 65950 | U16 | ALTA | RABBT | 61.42 | 61.25 | 122.67 | 61.42 | 61.25 | 122.67 | 245.34 |
| 14 | HARDING Sarah | 62953 | U16 | ALTA | SUNSH | 61.63 | 62.34 | 123.97 | 61.63 | 62.34 | 123.97 | 247.94 |
| 23 | MCNEILL Emily | 66105 | U16 | ALTA | LKLSE | 61.77 | 62.26 | 124.03 | 61.77 | 62.26 | 124.03 | 248.06 |
| 7 | HENKELMAN Megan | 62958 | U16 | ALTA | KASC | 61.78 | 62.62 | 124.4 | 61.78 | 62.62 | 124.4 | 248.8 |
Several Example 2:
-
Runs – 2 1-run SGs
-
Subtotals – None
-
Report Result – Best run of the 2 runs
Click on Several, and the following is displayed:

Click on ‘1’, and the following is displayed:
Click on ‘1 Totals’, and the following is displayed:

Enter 2 and click on ‘Okay’. The following is displayed:

Enter 1 and click on ‘Okay’. The following is displayed:
Select the first race file and click on ‘Open’. The following is displayed:

Click on ‘Okay’. The following window is opened:

Select your second race file, and click on ‘Open’. The following window is displayed:

Click ‘Okay’ and the following window is displayed:

Name your .csv file and select where to save it. Click ‘Open’ and the following window is displayed:

Click ‘Yes’ to create a new file; and the following is displayed.

Following is an excerpt of the file created:
| Bib | Name | Code | Cat | Div | Club | Run 1 | Run 2 | Best Time |
|---|---|---|---|---|---|---|---|---|
| 4 | MCINTYRE Jenna | 62996 | U16 | ALTA | LKLSE | 600 | 60.56 | 60.56 |
| 13 | TURNER Andrea | 63055 | U16 | ALTA | KASC | 60.68 | 60.99 | 60.68 |
| 11 | KOLBJORNSRUD Anna | 62977 | U16 | ALTA | CARC | 61.22 | 61.03 | 61.03 |
| 38 | MELINCHUK Hannah | 65950 | U16 | ALTA | RABBT | 61.42 | 61.25 | 61.25 |
| 14 | HARDING Sarah | 62953 | U16 | ALTA | SUNSH | 61.63 | 62.34 | 61.63 |
| 23 | MCNEILL Emily | 66105 | U16 | ALTA | LKLSE | 61.77 | 62.26 | 61.77 |
| 7 | HENKELMAN Megan | 62958 | U16 | ALTA | KASC | 61.78 | 62.62 | 61.78 |
| 1 | COOK Kelsey | 63425 | U16 | ALTA | PANO | 64.1 | 62.81 | 62.81 |
| 3 | CASEY Sierra | 62910 | U16 | ALTA | RABBT | 63.7 | 63.05 | 63.05 |
| 49 | MCCARTHY Jocelyn | 65309 | U16 | ALTA | RABBT | 65.44 | 63.19 | 63.19 |
| 15 | BERENDT Mckenzie | 62896 | U16 | ALTA | SUNSH | 64.69 | 63.3 | 63.3 |
| 16 | CORMIER Lisa | 62916 | U16 | ALTA | SUNSH | 63.31 | 63.42 | 63.31 |
| 22 | WOOD Sophie | 65701 | U 16 | ALTA | AASA | 63.32 | 64.08 | 63.32 |
| 6 | VAN DER VOORT Sydney | 63058 | U 16 | ALTA | LKLSE | 64.01 | 63.54 | 63.54 |
Several Example 3:
-
Runs – 4 1-run SGs
-
Subtotals – 2 (1 after each 2 runs)
-
Report Result – Best time of either subtotal 1 or 2

Click on ‘Several’. The following window is shown:

Click on ‘2’ and the following window is shown:

Click on ‘1 Totals’ and the following is displayed

Enter 2 and click on ‘Okay’ and the following is displayed:

Enter 1 and click on ‘Okay’ the following window is displayed:
Select the first race and click on ‘Open’ and the following window is displayed

Click ‘Okay’ and the following window is displayed:
Select the 2nd race and click ‘Open’ and the following is displayed:
Click on ‘Okay’ and the following is displayed

Click on ‘1 Totals’ and the following is displayed:

Enter 2 for the 2nd best of sub total and click on ‘Okay’. The following window is displayed

Enter 1 for the number of races to be included in the best of total – 2nd best of subtotal and click on ‘Okay’
Select the 1st of the 2ndraces and click on ‘Okay’, the following is displayed:

Click on ‘Okay’, the following window is displayed:
Select the 2nd run and click ‘Okay’. The following window is displayed:
Click ‘Okay’ and the following window is displayed:
Name your .csv file and select where to save it. Click ‘Open’ and the following window is displayed:

Click ‘Yes’ to create a new file; and the following is displayed.

Following is an excerpt of the file created:
| Bib | Name | Card | Cat | Div | Club | Run 1 | Run 2 | Best of 1st 2 Runs | Run3 | Run4 | Best of 2nd 2 Runs | Best of Sub Total 1 or 2 |
|---|---|---|---|---|---|---|---|---|---|---|---|---|
| 4 | MCINTYRE Jenna | 62996 | U 16 | ALTA | LKLSE | 600 | 60.56 | 60.56 | 600 | 60.56 | 60.56 | 121.12 |
| 13 | TURNER Andrea | 63055 | U 16 | ALTA | KASC | 60.68 | 60.99 | 60.68 | 60.68 | 60.99 | 60.68 | 121.36 |
| 11 | KOLBJORNSRUD Anna | 62977 | U 16 | ALTA | CARC | 61.22 | 61.03 | 61.03 | 61.22 | 61.03 | 61.03 | 122.06 |
| 38 | MELINCHUK Hannah | 65950 | U 16 | ALTA | RABBT | 61.42 | 61.25 | 61.25 | 61.42 | 61.25 | 61.25 | 122.5 |
| 14 | HARDING Sarah | 62953 | U 16 | ALTA | SUNSH | 61.63 | 62.34 | 61.63 | 61.63 | 62.34 | 61.63 | 123.26 |
| 23 | MCNEILL Emily | 66105 | U 16 | ALTA | LKLSE | 61.77 | 62.26 | 61.77 | 61.77 | 62.26 | 61.77 | 123.54 |
| 7 | HENKELMAN Megan | 62958 | U 16 | ALTA | KASC | 61.78 | 62.62 | 61.78 | 61.78 | 62.62 | 61.78 | 123.56 |
| 1 | COOK Kelsey | 63425 | U 16 | ALTA | PANO | 64.1 | 62.81 | 62.81 | 64.1 | 62.81 | 62.81 | 125.62 |
| 3 | CASEY Sierra | 62910 | U 16 | ALTA | RABBT | 63.7 | 63.05 | 63.05 | 63.7 | 63.05 | 63.05 | 126.1 |
| 49 | MCCARTHY Jocelyn | 65309 | U 16 | ALTA | RABBT | 65.44 | 63.19 | 63.19 | 65.44 | 63.19 | 63.19 | 126.38 |
| 15 | BERENDT Mckenzie | 62896 | U 16 | ALTA | SUNSH | 64.69 | 63.3 | 63.3 | 64.69 | 63.3 | 63.3 | 126.6 |
| 16 | CORMIER Lisa | 62916 | U 16 | ALTA | SUNSH | 63.31 | 63.42 | 63.31 | 63.31 | 63.42 | 63.31 | 126.62 |
| 22 | WOOD Sophie | 65701 | U 16 | ALTA | AASA | 63.32 | 64.08 | 63.32 | 63.32 | 64.08 | 63.32 | 126.64 |
Several Example 4:
-
Runs – 4 1-run SGs
-
Subtotals – None
-
Report Result – Best of 4 runs

Click on ‘Several’. The following window is shown:

Click on ‘1’ and the following window is shown:

Click on ‘1 Totals’ and the following window is shown:

Enter 4 and click ‘Okay’, and the following window is shown:

Enter 1 and click ‘Okay’, and the following window is shown:
Select Race 1 and click ‘Open’, and the following window is shown:

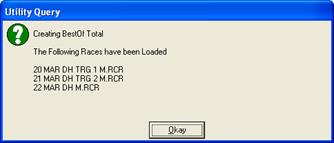
Click ‘Okay’ and the ‘Open Race File window is displayed. Select the next 3 races and the following window is displayed:
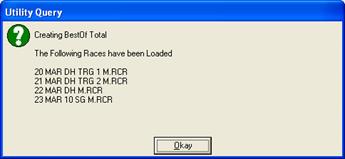
Note that I have selected 3 DH’s and 1 SG. Click on ‘Okay’ and the following is displayed:
Name the file and click ‘open’ to save the file and the following is displayed:

Click ‘yes’ and the following is displayed:

Click ‘Okay’ to finish the report.
Following is an excerpt of the file created:
| Bib | Name | Code | Class | Nat | Club | Run 1 | Run2 | Run 3 | Run 4 | Best of 4 times |
|---|---|---|---|---|---|---|---|---|---|---|
| 7 | OSBORNE-PARADIS Manuel | 102899 | SR | CAN | WHIST | 56.6 | 600 | 54.92 | 67.29 | 54.92 |
| 17 | HALBERT Kelby | 103656 | U 21 | CAN | TSCBM | 57.19 | 600 | 55.64 | 600 | 55.64 |
| 5 | GUAY Erik | 102263 | SR | CAN | TREMB | 56.64 | 600 | 55.76 | 66.72 | 55.76 |
| 8 | NELLA Tyler | 103375 | SR | CAN | GEORG | 57.11 | 600 | 55.95 | 68.32 | 55.95 |
| 10 | HUDEC Jan | 102271 | SR | CAN | BANFF | 57.51 | 600 | 56 | 66.88 | 56 |
| 6 | COOK Dustin | 100558 | SR | CAN | MARIE | 56.96 | 600 | 56.06 | 67.95 | 56.06 |
| 4 | DAWSON Travis | 103313 | SR | CAN | FERNI | 57.22 | 600 | 56.44 | 70.1 | 56.44 |
| 11 | THOMSEN Benjamin | 103271 | SR | CAN | WINDR | 58.52 | 600 | 56.46 | 67.93 | 56.46 |
| 1 | SEMPLE Ryan | 102403 | SR | CAN | TREMB | 57.9 | 600 | 56.57 | 68.22 | 56.57 |
| 25 | TAFEL Tristan | 103623 | U 21 | CAN | BANFF | 58.99 | 600 | 56.87 | 600 | 56.87 |
| 32 | PHILP Trevor | 103865 | U 21 | CAN | BANFF | 58.86 | 600 | 56.92 | 600 | 56.92 |
| 20 | SPENCE Brad | 102912 | SR | CAN | NATC | 59.07 | 600 | 56.99 | 68.69 | 56.99 |
| 55 | JANYK Michael | 102435 | SR | CAN | WHIST | 59.99 | 600 | 57 | 68.84 | 57 |
| 24 | LEDUC Mathieu | 103583 | U 21 | CAN | MTWAS | 59.3 | 600 | 57.1 | 69.7 | 57.1 |
| 13 | BROWN Philip | 103676 | U 21 | CAN | ASA | 59.02 | 600 | 57.21 | 600 | 57.21 |
| 35 | TOUTANT Simon-Claude | 103751 | U 21 | CAN | VSC | 59.13 | 600 | 57.27 | 72.88 | 57.27 |
Several Example 5:
-
Runs – 6 1-run Races
-
Subtotals – 3 (1 subtotal after every 2 races)
-
Report Result – Grand Total of all 6 races

Click on ‘Several’. The following window is shown:

Click on ‘3’ and the following window is shown:
Click on ‘1 Totals’ and the following window is shown:

Enter 2 and click ‘Okay’. The following is displayed:

Enter 2 (this will give a total of both races) and click on ‘Okay’

Select the first race and click ‘Open’

Click ‘Okay’ and select the second race and click ‘Open’
Click Okay:
Click ‘1 Totals’ and

Enter 2 and click ‘Okay’’

Enter 2 and click ‘Okay’
Repeat for 3^rd^ best of sub total
And save .csv file
Following is an excerpt of the file created:
| Bib | Name | Code | Class | NAT | Club | Run 1 | Run 2 | Total 1 & 2 | Run 3 | Run 4 | Total 3 & 4 | Run 5 | Run 6 | Total 5 & 6 | Total All |
|---|---|---|---|---|---|---|---|---|---|---|---|---|---|---|---|
| 10 | OSBORNE-PARADIS Manuel | 102899 | SR | CAN | WHIST | 56.6 | 600 | 656.6 | 54.92 | 600 | 654.92 | 56.6 | 54.92 | 111.52 | 1423.04 |
| 12 | GUAY Erik | 102263 | SR | CAN | TREMB | 56.64 | 600 | 656.6 | 55.76 | 600 | 655.76 | 56.64 | 55.76 | 112.4 | 1424.8 |
| 8 | HALBERT Kelby | 103656 | U 21 | CAN | TSCBM | 57.19 | 600 | 657.2 | 55.64 | 600 | 655.64 | 57.19 | 55.64 | 112.83 | 1425.66 |
| 7 | COOK Dustin | 100558 | SR | CAN | MARIE | 56.96 | 600 | 657 | 56.06 | 600 | 656.06 | 56.96 | 56.06 | 113.02 | 1426.04 |
| 11 | NELLA Tyler | 103375 | SR | CAN | GEORG | 57.11 | 600 | 657.1 | 55.95 | 600 | 655.95 | 57.11 | 55.95 | 113.06 | 1426.12 |
| 14 | HUDEC Jan | 102271 | SR | CAN | BANFF | 57.51 | 600 | 657.5 | 56 | 600 | 656 | 57.51 | 56 | 113.51 | 1427.02 |
| 6 | DAWSON Travis | 103313 | SR | CAN | FERNI | 57.22 | 600 | 657.2 | 56.44 | 600 | 656.44 | 57.22 | 56.44 | 113.66 | 1427.32 |
| 5 | SEMPLE Ryan | 102403 | SR | CAN | TREMB | 57.9 | 600 | 657.9 | 56.57 | 600 | 656.57 | 57.9 | 56.57 | 114.47 | 1428.94 |
| 9 | THOMSEN Benjamin | 103271 | SR | CAN | WINDR | 58.52 | 600 | 658.5 | 56.46 | 600 | 656.46 | 58.52 | 56.46 | 114.98 | 1429.96 |
| 13 | WERRY Tyler | 103762 | U 21 | CAN | FERNI | 57.91 | 600 | 657.9 | 57.63 | 600 | 657.63 | 57.91 | 57.63 | 115.54 | 1431.08 |
| 1 | PHILP Trevor | 103865 | U 21 | CAN | BANFF | 58.86 | 600 | 658.9 | 56.92 | 600 | 656.92 | 58.86 | 56.92 | 115.78 | 1431.56 |
| 45 | TAFEL Tristan | 103623 | U 21 | CAN | BANFF | 58.99 | 600 | 659 | 56.87 | 600 | 656.87 | 58.99 | 56.87 | 115.86 | 1431.72 |
| 4 | PRIDY Conrad | 103385 | SR | CAN | WHIST | 58.59 | 600 | 658.6 | 57.38 | 600 | 657.38 | 58.59 | 57.38 | 115.97 | 1431.94 |
9. SEVERAL BEST OF RESULTS – 2 RUN RACES:
Example 1: Several 2-Run Race
-
Runs: 2– 2-run GSs
-
Subtotals – 2 (1 after each 2 runs)
-
Report Result: Total of all 4 runs

Click on ‘Several’. The following window is shown:

Click on ‘2’ and the following window is shown:
Click on ‘2 Runs’ and the following is displayed

Enter 1 and click ‘okay’

Enter 2 and click ‘okay’

Select the first race and click ‘open’

Click ‘Okay’
Click on ‘2 runs’

Enter ‘1’ and click ‘Okay’

Enter 2 and click ‘okay’
Select the 2nd race and click ‘open’
Name the .csv file and select the desired directory and folder. Click ‘open’

Click ‘Yes’

Click ‘okay’
Following is an excerpt of the .csv file produced:
| Bib | Name | Code | NAT | Run 1 Race 1 | Run 2 Race 1 | Sub Total 1 | Run 1 Race 2 | Run 2 Race 2 | Sub Total | Grand Total of All Runs |
|---|---|---|---|---|---|---|---|---|---|---|
| 8 | LEDUC Mathieu | 103583 | CAN | 46.08 | 49.08 | 95.16 | 49.86 | 49.87 | 99.73 | 194.89 |
| 19 | LAW Michael | 103987 | CAN | 50.67 | 50.78 | 101.45 | 53.92 | 52.26 | 106.18 | 207.63 |
| 33 | COOMBE Brydon | 104115 | CAN | 55.3 | 51.98 | 107.28 | 55.3 | 53.9 | 109.2 | 216.48 |
| 26 | LAW David | 103986 | CAN | 54.1 | 52.24 | 106.34 | 57.41 | 53.19 | 110.6 | 216.94 |
| 34 | SWETTE Ford | 104026 | CAN | 52.97 | 54.37 | 107.34 | 56.37 | 54.79 | 111.16 | 218.5 |
| 59 | WYCLIFFE-JONES Alastair | 104185 | CAN | 54.37 | 54.97 | 109.34 | 58.31 | 56.91 | 115.22 | 224.56 |
| 21 | SMART Roy | 7E+06 | USA | 55.73 | 55.13 | 110.86 | 61.38 | 56.21 | 117.59 | 228.45 |
| 58 | ARMSTRONG Robert | 104072 | CAN | 57.15 | 55.37 | 112.52 | 60.29 | 56.93 | 117.22 | 229.74 |
| 56 | MCIVER John | 104087 | CAN | 57.29 | 55.75 | 113.04 | 58.87 | 58.03 | 116.9 | 229.94 |
| 76 | COOKSON Bryan | 104075 | CAN | 57.08 | 54.95 | 112.03 | 61.73 | 57.52 | 119.25 | 231.28 |
| 43 | ZUMWALT Joshua | 104042 | CAN | 67.6 | 53.14 | 120.74 | 57.32 | 53.27 | 110.59 | 231.33 |
| 63 | KEITH Jacob | 7E+06 | USA | 59.28 | 56.48 | 115.76 | 60.65 | 57.84 | 118.49 | 234.25 |
Example 2: Several 2-Run Race
-
Runs: 2– 2-run GSs
-
Subtotals – None
-
Report Result: best time of the 4 runs

Click on ‘Several’. The following window is shown:

Click on ‘1’ and the following window is shown:
Click on ‘2 Runs’ and the following is displayed
Enter 2 and click ‘okay’
Enter 1 and click on ‘okay’
Select the first race and click on ‘open’

Click on ‘okay’
Repeat the above 2 figures for the second race
Name the file and select the desired directory and file folder. Click on ‘Open’

Click on ‘Yes’

Click on ‘Okay’
Following is an excerpt of the .csv file
| Bib | Name | Code | NAT | Run 1 Race 1 | Run 2 Race 1 | Run 1 Race 2 | Run 2 Race 2 | Best of 4 Runs |
|---|---|---|---|---|---|---|---|---|
| 8 | LEDUC Mathieu | 103583 | CAN | 46.08 | 49.08 | 49.86 | 49.87 | 46.08 |
| 1 | PEDERSEN Cody | 103725 | CAN | 48.56 | 48.06 | 50.23 | 600 | 48.06 |
| 13 | EVANS Jack | 220939 | GBR | 48.12 | 600 | 51.78 | 600 | 48.12 |
| 12 | MORRIS Spencer | 103999 | CAN | 48.64 | 600 | 53.57 | 52.94 | 48.64 |
| 18 | MCKILLOP Curtis | 103994 | CAN | 51.78 | 50.57 | 600 | 600 | 50.57 |
| 19 | LAW Michael | 103987 | CAN | 50.67 | 50.78 | 53.92 | 52.26 | 50.67 |
| 2 | MASSING Geoffrey | 103252 | CAN | 600 | 600 | 53.05 | 50.69 | 50.69 |
| 29 | KONANTZ William | 103979 | CAN | 50.72 | 600 | 54.29 | 52.01 | 50.72 |
| 20 | VAUGEOIS Sean | 104030 | CAN | 50.74 | 600 | 54.31 | 53.7 | 50.74 |
| 24 | THOMPSON Broderick | 104096 | CAN | 51.33 | 600 | 54.26 | 600 | 51.33 |
10. SINGLE BESTOF RESULTS:
Click on the “SINGLE” Button (if you simply wish to get the Best 2 runs of 4 One run Races. In this Case it simply picks the best 2 One Run Races and Totals them, They could be both from the morning, or both from the afternoon or One from the morning and one from the afternoon.)
Single Example 1:
-
Runs – 3 1-run Races
-
Subtotals – None
-
Report Result – Best Run of the 3

Click on ‘Single’ and the following query is displayed:

Click on 1 Total when analyzing one run races or the total time of two run races.

Enter the number of race results the report is to be based on and click ‘Okay’

Enter the number of races to include in the best of total (can be between 1 and 3). Click on ‘Okay’
Select the first race file and click ‘Open’. Repeat for the number of races you have selected above.
When you above window indicates the desired number of races – click ‘Okay’

Name the .csv file and select the file folder you want to save it to and click ‘Open’

Click on ‘Yes’

Click ‘Okay’
The following is an excerpt from the .csv file
| Bib | Name | Code | CAT | NAT | Club | Run 1 | Run 2 | Run 3 | Best of 3 |
|---|---|---|---|---|---|---|---|---|---|
| 10 | OSBORNE-PARADIS Manuel | 102899 | SR | CAN | WHIST | 56.6 | 600 | 54.92 | 54.92 |
| 8 | HALBERT Kelby | 103656 | U 21 | CAN | TSCBM | 57.19 | 600 | 55.64 | 55.64 |
| 12 | GUAY Erik | 102263 | SR | CAN | TREMB | 56.64 | 600 | 55.76 | 55.76 |
| 11 | NELLA Tyler | 103375 | SR | CAN | GEORG | 57.11 | 600 | 55.95 | 55.95 |
| 14 | HUDEC Jan | 102271 | SR | CAN | BANFF | 57.51 | 600 | 56 | 56 |
| 7 | COOK Dustin | 100558 | SR | CAN | MARIE | 56.96 | 600 | 56.06 | 56.06 |
| 6 | DAWSON Travis | 103313 | SR | CAN | FERNI | 57.22 | 600 | 56.44 | 56.44 |
| 9 | THOMSEN Benjamin | 103271 | SR | CAN | WINDR | 58.52 | 600 | 56.46 | 56.46 |
| 5 | SEMPLE Ryan | 102403 | SR | CAN | TREMB | 57.9 | 600 | 56.57 | 56.57 |
| 45 | TAFEL Tristan | 103623 | U 21 | CAN | BANFF | 58.99 | 600 | 56.87 | 56.87 |
| 1 | PHILP Trevor | 103865 | U 21 | CAN | BANFF | 58.86 | 600 | 56.92 | 56.92 |
| 20 | SPENCE Brad | 102912 | SR | CAN | NATC | 59.07 | 600 | 56.99 | 56.99 |
| 35 | JANYK Michael | 102435 | SR | CAN | WHIST | 59.99 | 600 | 57 | 57 |
| 19 | LEDUC Mathieu | 103583 | U 21 | CAN | MTWAS | 59.3 | 600 | 57.1 | 57.1 |
** ‘SINGLE’ Example 2:**
-
Runs – 2 1-run Races
-
Subtotals – None
-
Report Result – Grand Total of all 2 races

Click on ‘Single’ and the following query is displayed:

Click on 1 Total when analyzing one run races or the total time of two run races.

Enter the number of races to be included in the report – 2 and click on ‘Okay’

Enter the number of races to include in the best of total – ‘2’ and click ‘okay’
Select the first race and click ‘open’

Repeat the above 2 steps for the next races

When all the races have been loaded click ‘okay’
Name and save the file to the desired folder and click ‘open’
Click ‘Yes’
Click ‘Okay’
Below is an excerpt from the .csv file
| Bib | Name | Code | Class | NAT | Club | Run 1 | Run 2 | Total 1 & 2 |
|---|---|---|---|---|---|---|---|---|
| 28 | HUDEC Jan | 102271 | SR | CAN | BANFF | 66.88 | 68.54 | 135.42 |
| 4 | SEMPLE Ryan | 102403 | SR | CAN | TREMB | 68.22 | 68.08 | 136.3 |
| 10 | NELLA Tyler | 103375 | SR | CAN | GEORG | 68.32 | 68.49 | 136.81 |
| 14 | SWENSSON Joe | 530920 | SR | USA | 68.15 | 68.71 | 136.86 | |
| 9 | THOMSEN Benjamin | 103271 | SR | CAN | WINDR | 67.93 | 69.21 | 137.14 |
| 8 | COOK Dustin | 100558 | SR | CAN | MARIE | 67.95 | 69.28 | 137.23 |
| 7 | JANYK Michael | 102435 | SR | CAN | WHIST | 68.84 | 68.61 | 137.45 |
Description of the Excel “csv” File:
1. The “csv” file that was produced by the “Best Of” utility can be opened in Excel by simply double click on the file.
2. The File will have the following columns:
a. Contains the Bib Numbers that the Racer had in the “Last” Measures File Loaded. b. Contains the Racers Name c. Contains the Racers “Card Number” d. Contains the Racers Category (ie: U 18, U 21) etc as shown in the “Last” Measures File. e. Contains the Racers “Nation or Division”, if present in the “Last” Measures File. f. Contains the Racers Club Name, if present in the “Last” Measures File g. Contains the first Races Totals or the First Run Times of the First File h. There are as many columns of the above information as there is Races or Runs. i. The Next Column will contain the Total or Subtotal of the “x” Best Races or Runs. j. If “SEVERAL” was chosen then the above will be repeated the number of times request and then one last column will be added with the Total of all of the subtotals.
Suggestions for Cleanup of Excel:
1. Once the file is opened it is suggested that the following cleanup actions be taken:
a. It is recommended that each column that contains times be formatted as numeric with 2 digits of decimal places. This can be done in the following manner:
i) Click on the Header letter of the first time column, then slide the horizontal slide bar at the bottom of the screen to the right until the last column containing data is visible, holding down the shift key, click on the Header Letter of the last column that contains data. This should highlight all of the columns that contain time data.
ii) Release the shift key.
b) Click on the word “Format” at the top of the screen c) Click on the word “Cells” in the drop down from the “Format” command d) In the drop down box that appears Click on the word “Number” e) Make sure that the “Decimal Places” contains “2” and click on the “Ok” button f) This will format all of the data columns to be numeric with 2 decimal places.
b. Double click on the vertical bar between the header alphabetical characters. In other words, place the cursor between the “A” and the “B” on the “|” between them and double click. This will size the “A” column. Continue to do this on the vertical bar “|” between every column, thus sizing each column to the data that is contained within it.
c. It is suggested that you save the spread sheet by clicking on the “File” command then the “Save As” command. Change the “Save as type” to the first entry in the drop down list. It is “Microsoft Excel Workbook (*.xls)” (NOTE: To find this entry, slide the vertical slide bar, that appeared, to the top). Once this is chosen click on the “Save” button.
d. It is recommended that you add whatever Titles etc you wish too then click on “File” then on “Save” to save your changes. KEEP IN MIND that once you have exited the spread sheet you will need to double click on the “xls” file not the original “csv” file in order to see the changes that you have made.
e. In order to print the entire spread sheet it is suggested that you click on the blank space that it to the right of the “A” column header letter and above the “1” of the row counter. This will highlight the entire spread sheet. You may then click on file “File” then on “Print Area” and on “set print area”. If you now click on “Save” the print area of the entire spread sheet (that contains data) will be set for future prints. You may now click on “File” and then “Print”.
6. Click on the “Ok” button to print your spread sheet to the printer.